

Original photo by Alan Cabello from Pexels
I heard some hype regarding Julia programming language lately. Julia is a programming language developed in MIT and some people said that Julia runs like C, but reads like Python
I believe that Julia has the potential to becomes the future of data science, so I decided to try this language and see how to do data science with it
This is not a Julia programming language tutorial or explanation of the mechanism behind Julia, but I want to show how the Data Science process will look like when using Julia so you can get the picture with this before learning to use Julia.
Installation and IDE
There are 2 popular ways of using Julia :
- Install from the official website https://julialang.org/ and integrate Julia with jupyterlab or
- Install Julia from https://juliacomputing.com/products/juliapro/ and use Julia with JunoIDE
So what’s the difference? Using the first way will let you code Julia inside JupyterLab which also similar to how google collab and Kaggle notebook works.
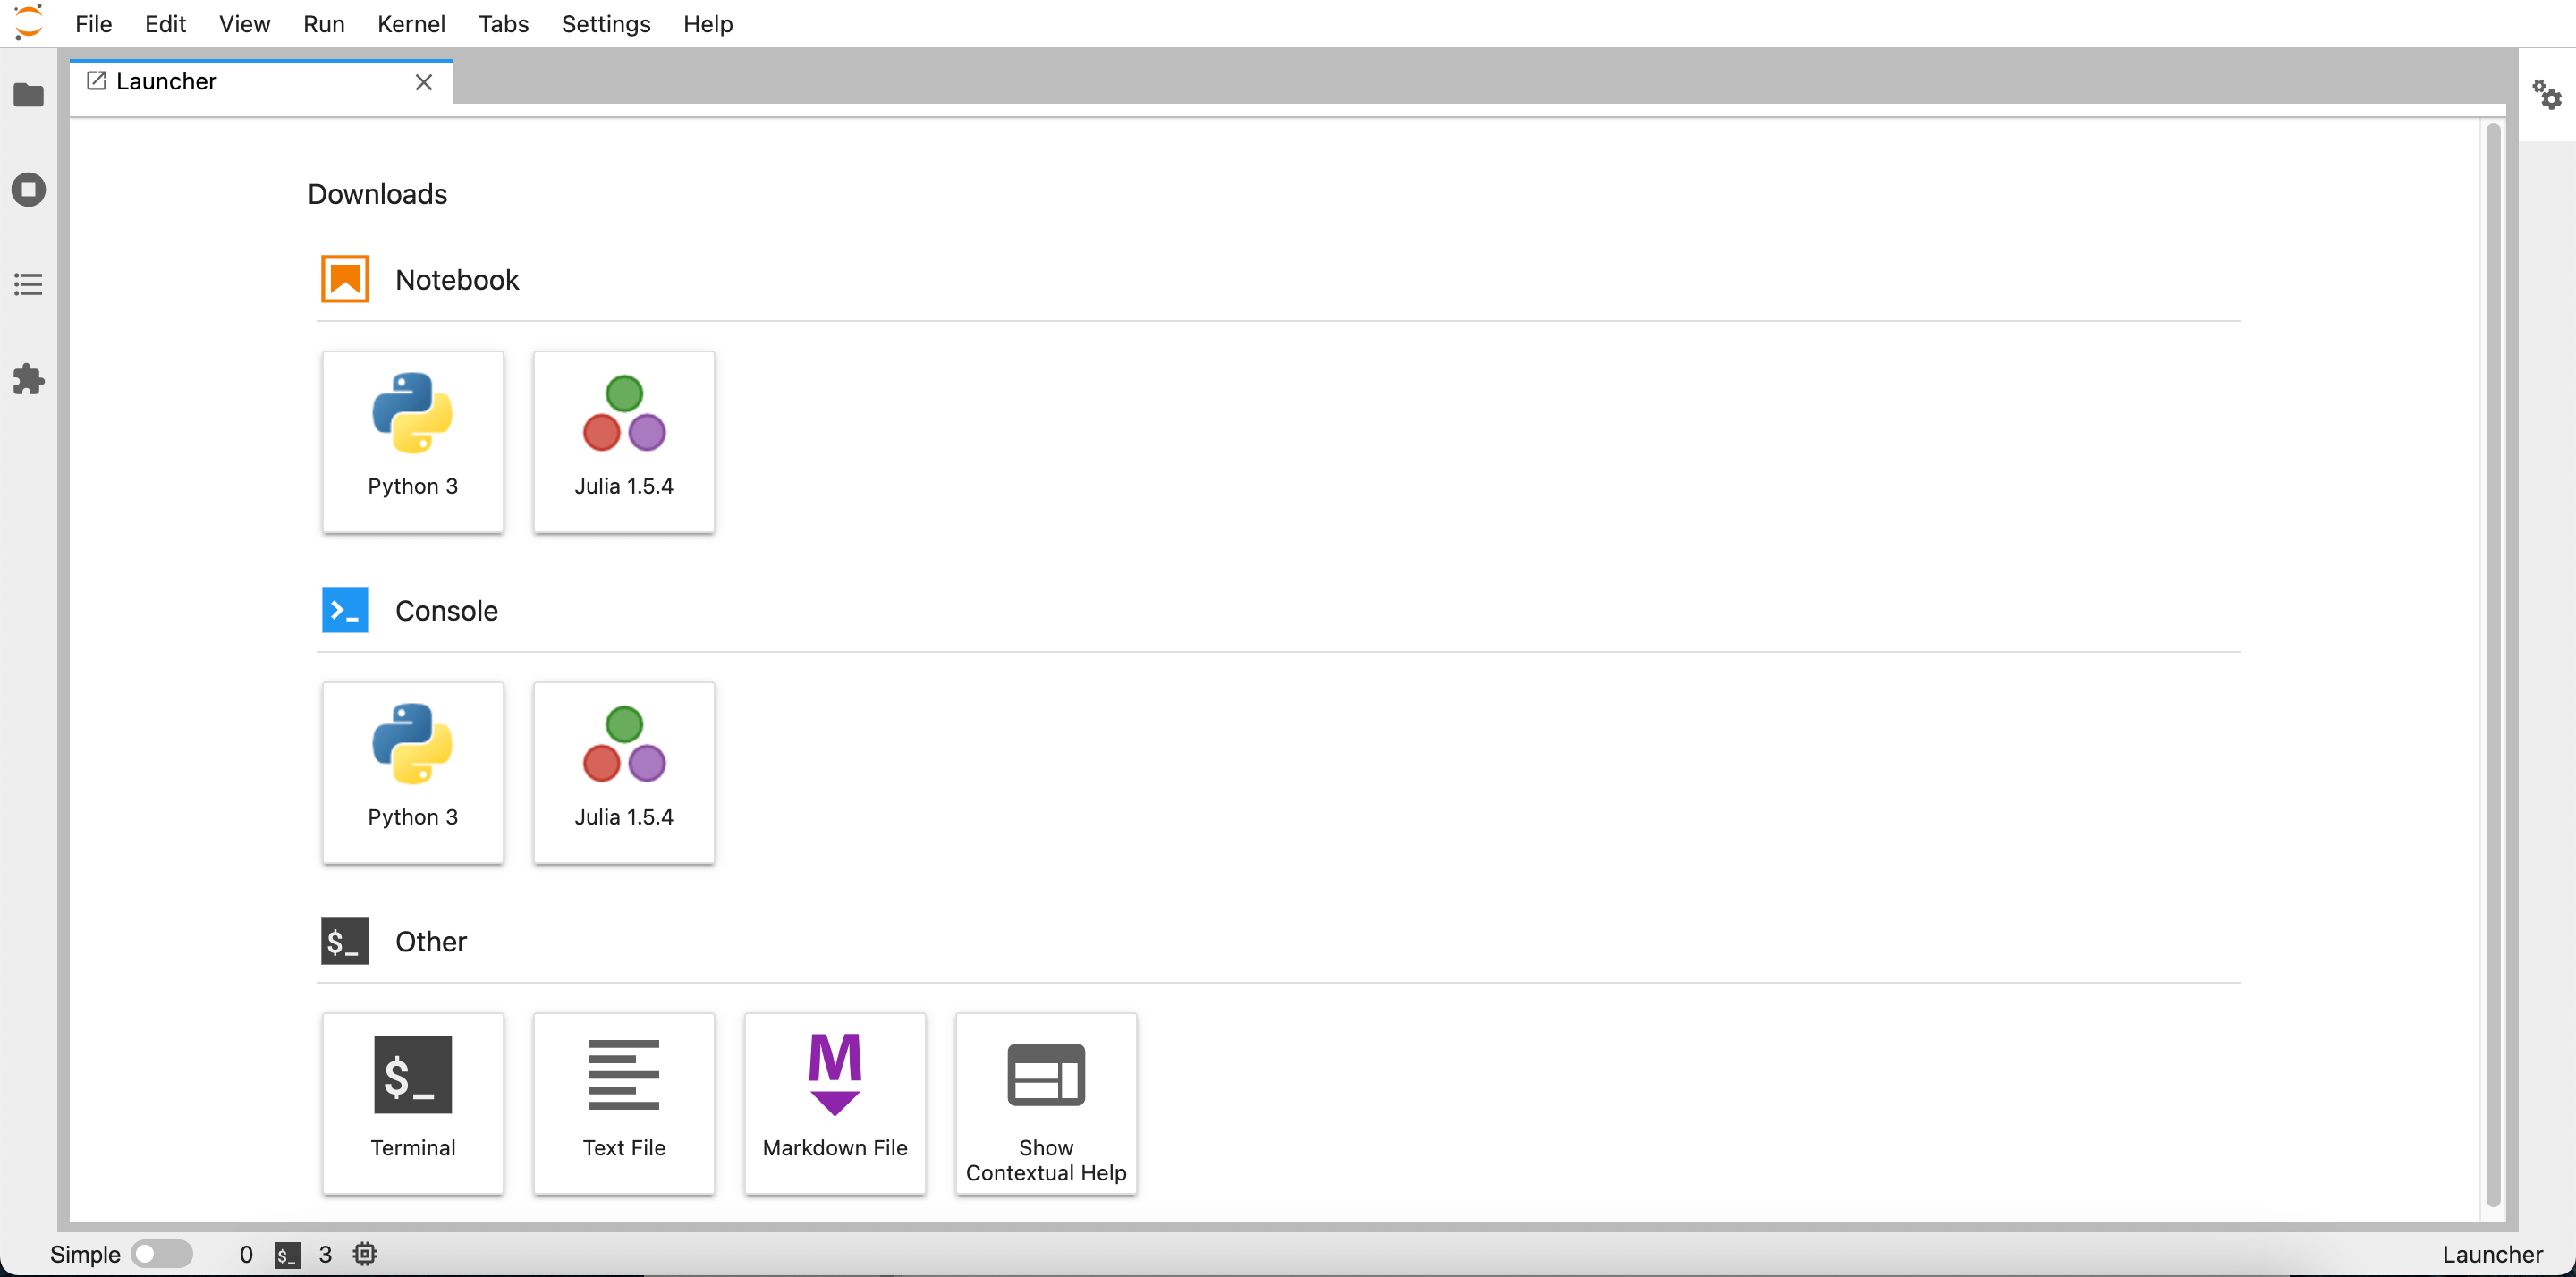 You can use Julia just like using python inside JupyterLab
The second way will give you Juno IDE that similar to RStudio, Spyder, or Matlab. Juno is basically an extension from Atom design specifically for Julia.
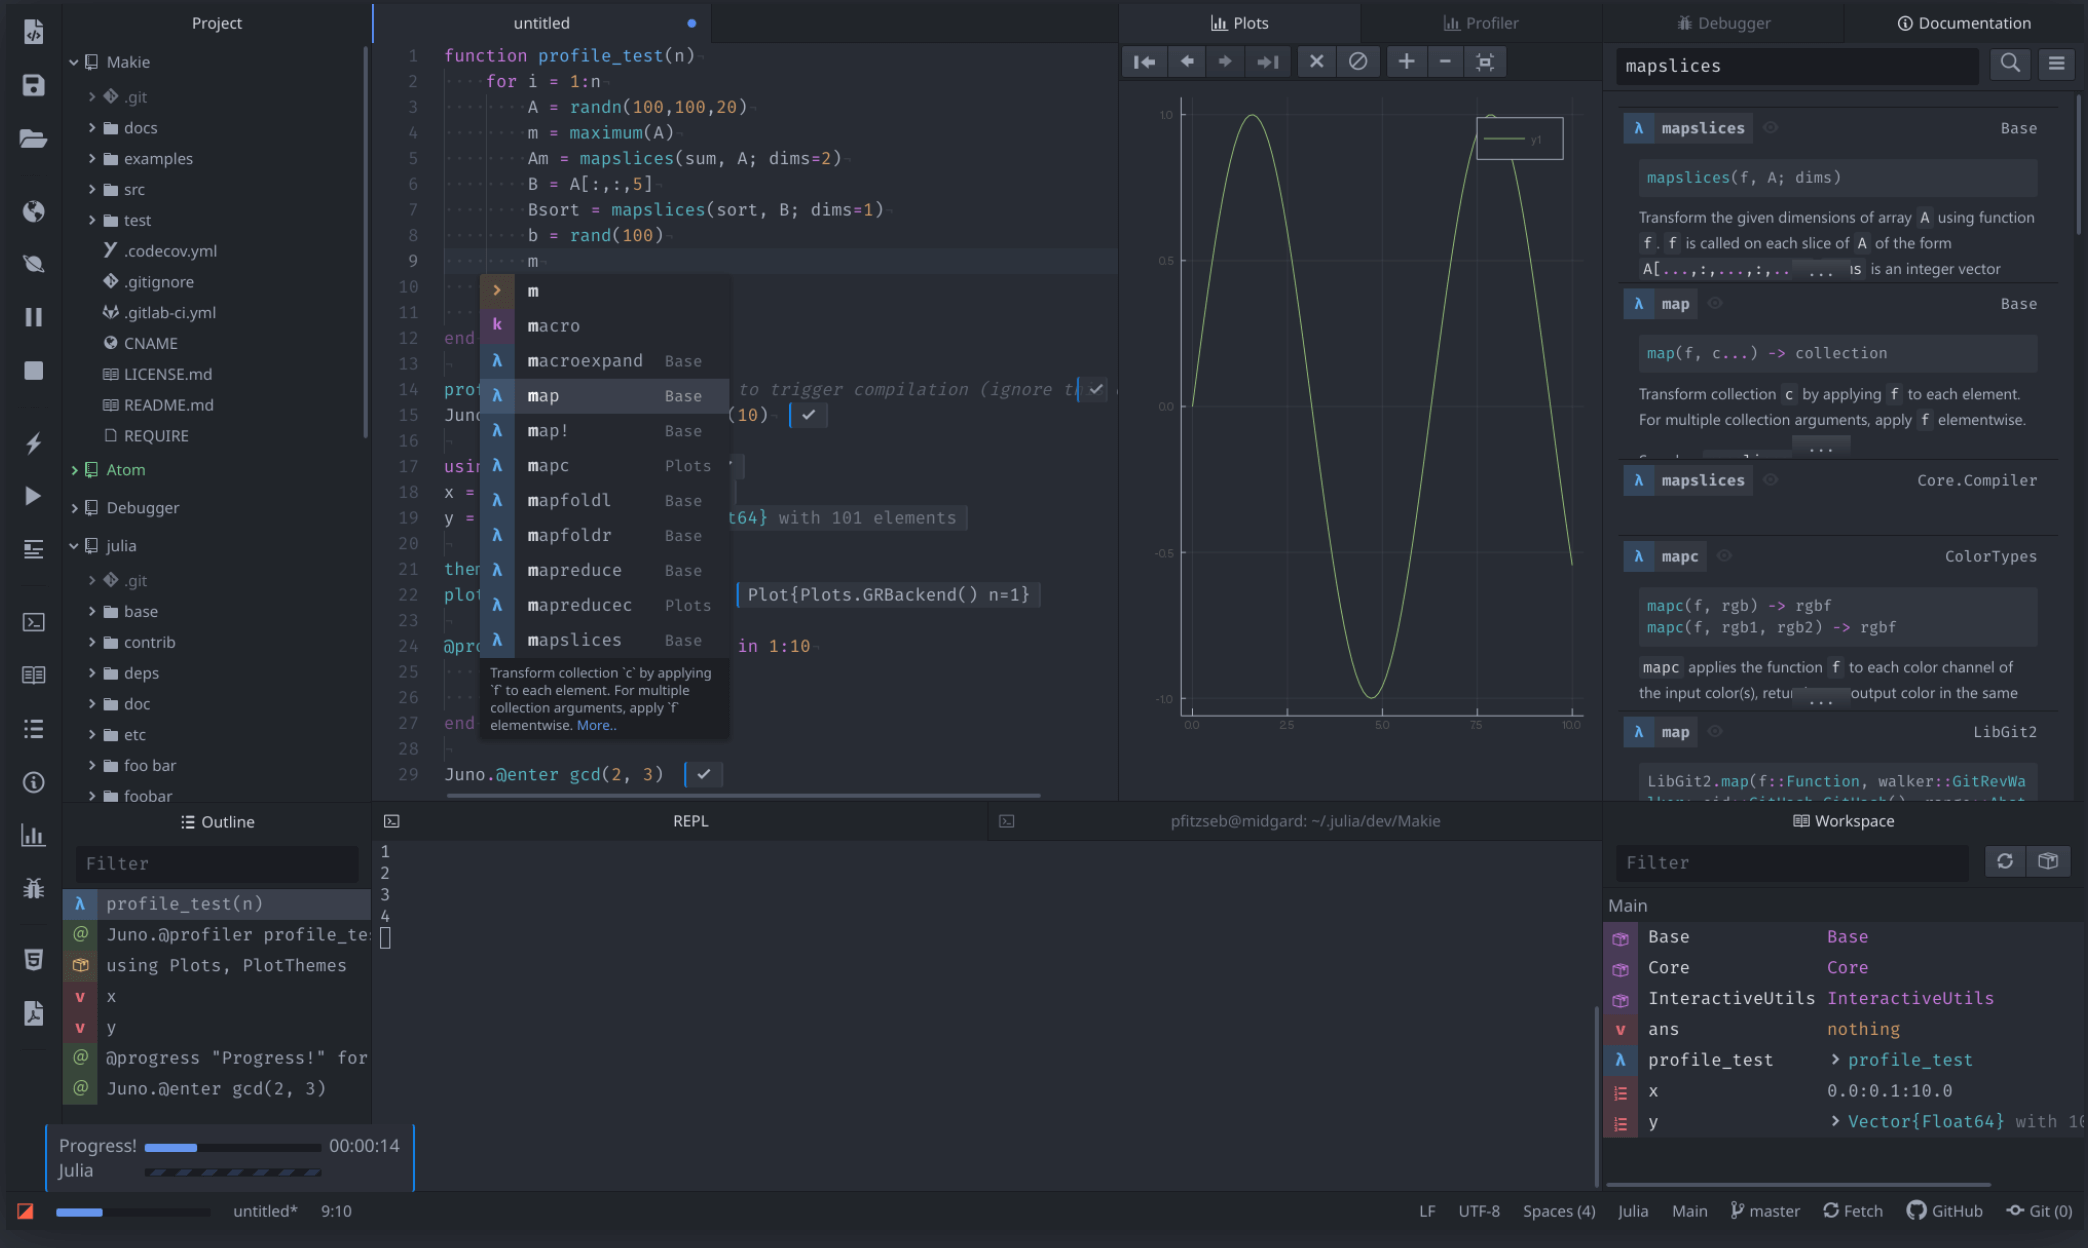 Juno give tons of features compared to Jupyter
I don’t know which one is more popular, but for a serious project, I will go to JunoIDE(There are rumor that Juno team are migrating into VS Code)
Package / library
Julia comes with its owns package manager which called Pkg. We can use Pkg inside the code, or by using its CLI. I will demonstrate how to install package inside the code
using Pkg # Import library
Pkg.generate("Titanic_Julia") # Create new environment(In Python similar to conda create and R similar to create new project), this line will also create new folder
Pkg.activate("Titanic_Julia") # Activate the new environment
cd("Titanic_Julia")
Pkg.add(["CSV","Chain","DataFrames","Lathe","Gadfly"])  #Install libraries, just need to run once

using Chain # Pipe operator similar to R's %>%
using Statistics
Data Reading
Currently, reading a csv file into a dataframe is 2 step process.
using CSV ,DataFrames # Import multiple libraries
csv_file = CSV.File(download("https://gist.githubusercontent.com/michhar/2dfd2de0d4f8727f873422c5d959fff5/raw/fa71405126017e6a37bea592440b4bee94bf7b9e/titanic.csv")) # Read the data, use download() if the data from internet
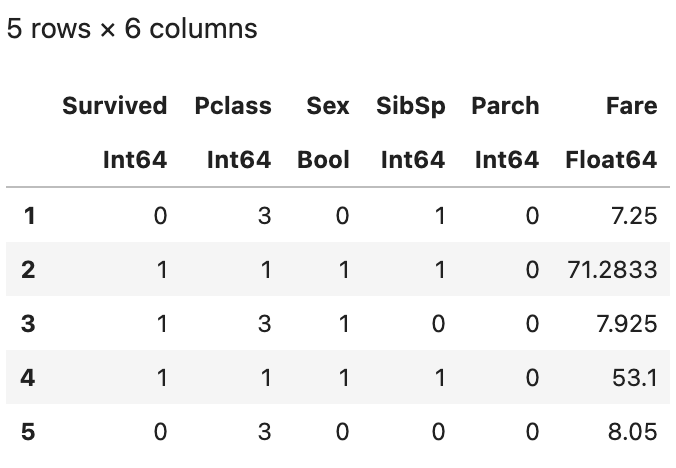
df = DataFrame(csv_file) #Convert the csv=>Dataframe
first(df,5) # Print the first 5 rows
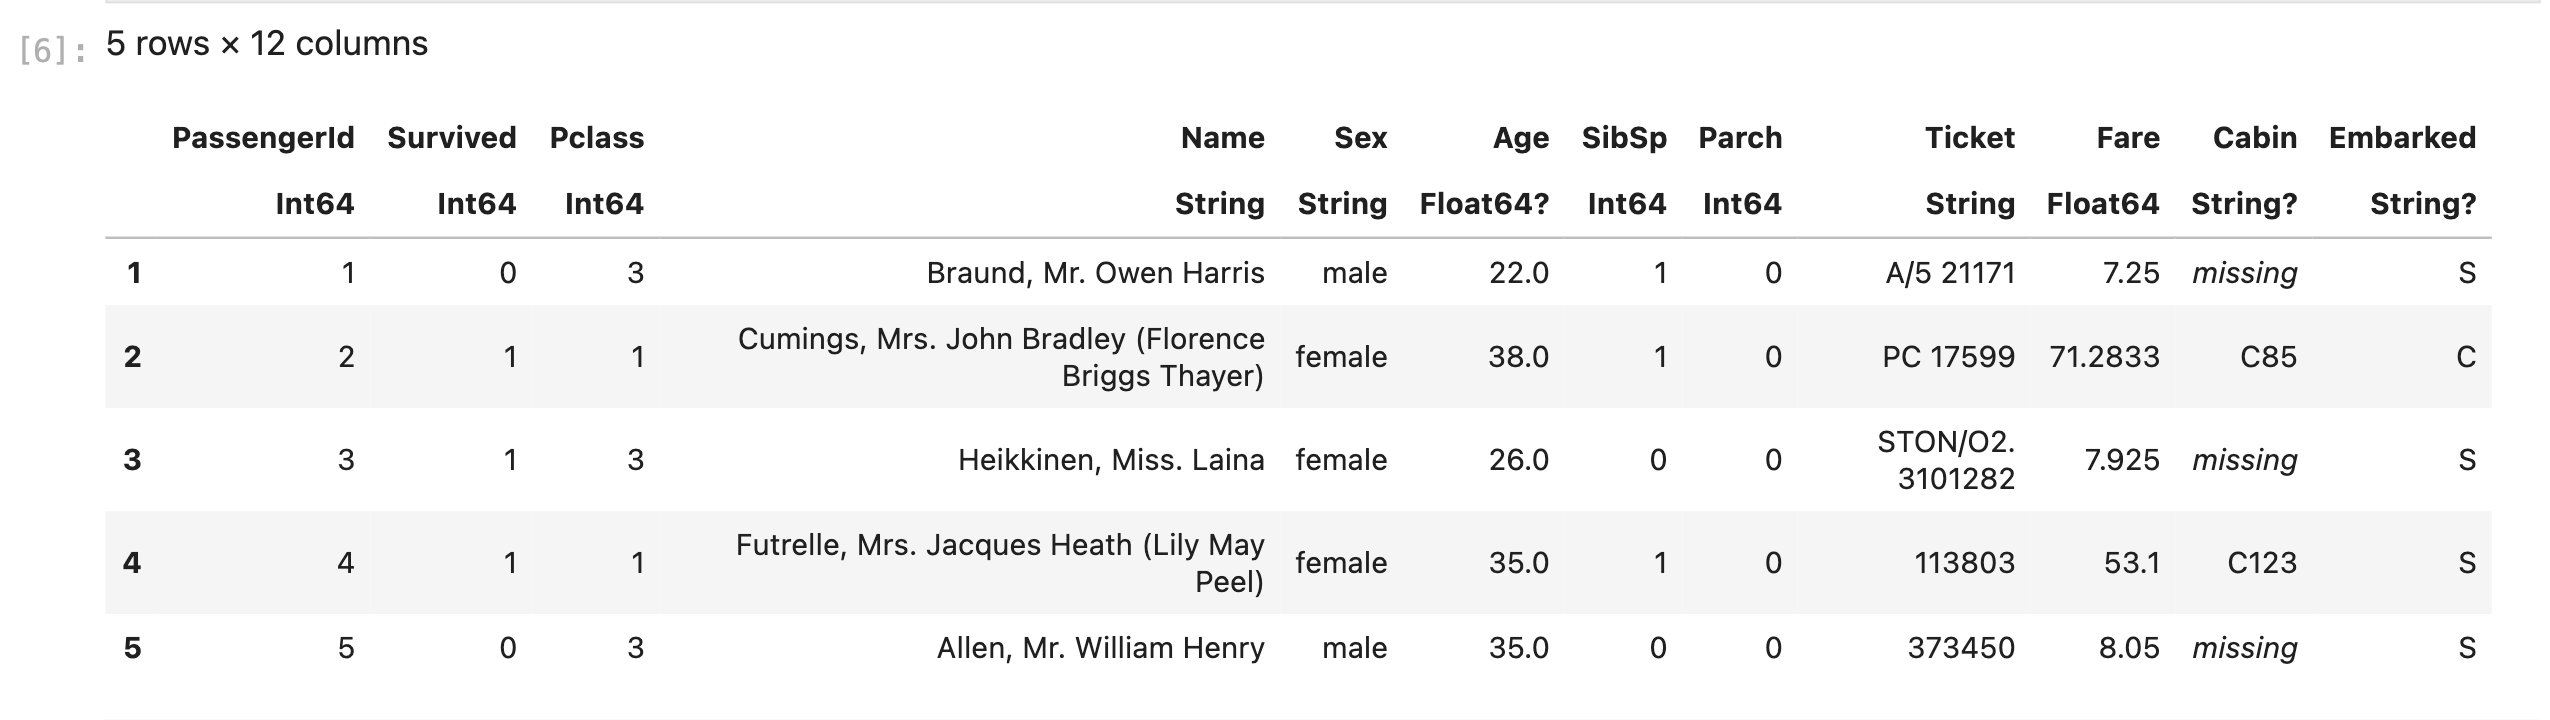
- that Julia starts indexing from 1 instead of 0.
- DataFrame will show data types below the column name, where ? in dtype implies existence of missing value in that column
- Missing value will be denoted as missing
describe(df) #Give a rough summary of the dataframe
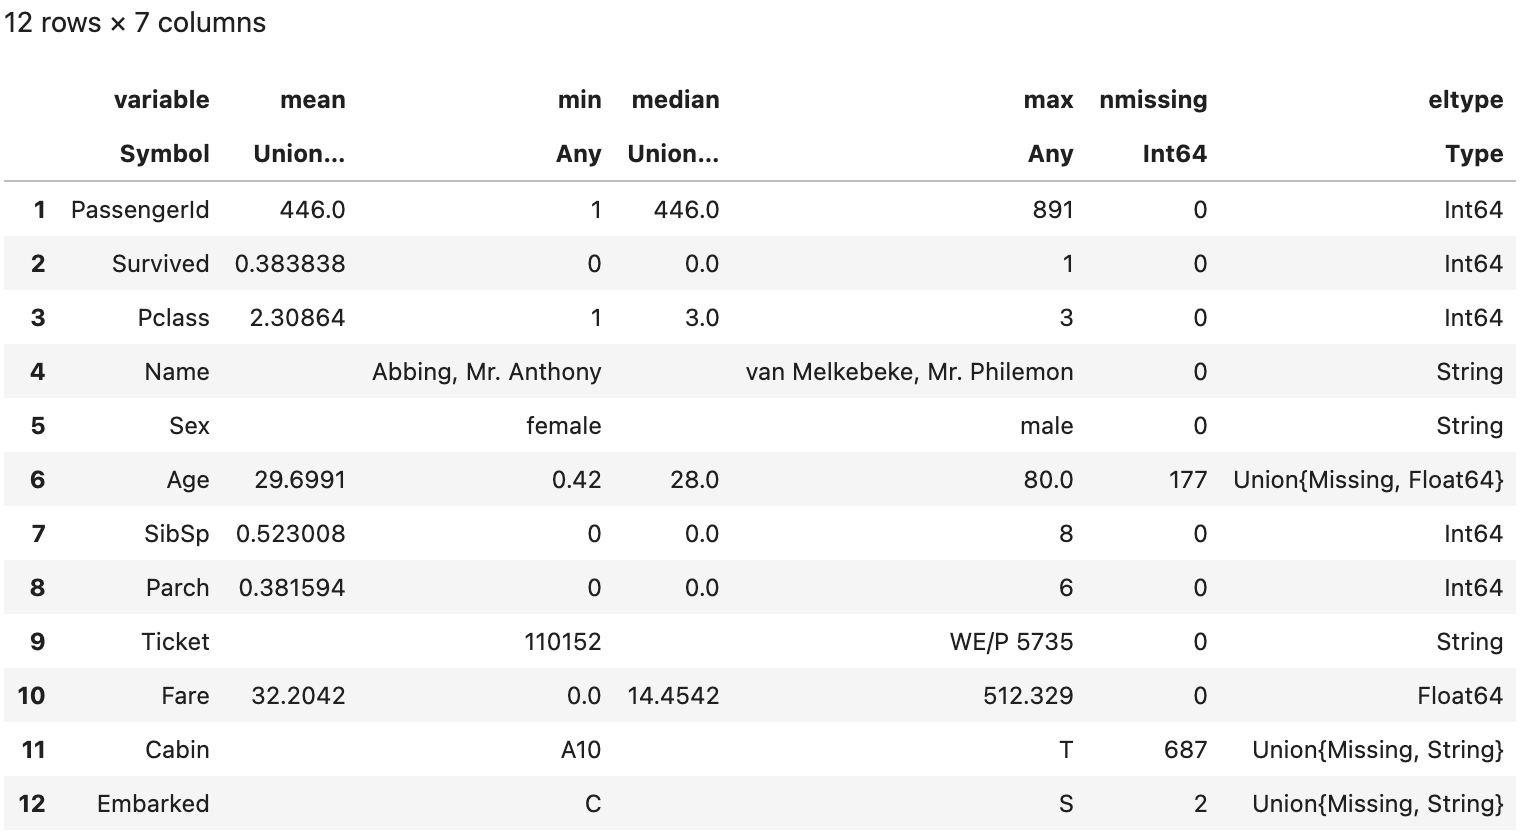 In last column(eltype), there are Union{Missing, Float64} on Age. This implies that the Age variable is a mixed datatype of Float64 and Missing.
Data Wrangling
To make code easier to write and read, I use the Chain package which similar to R’s magrittr. Basically what pipe operators do is put the object on the left side into an argument on the right side(x pipe f is equal to f(x)). Here’s an example of some common operation :
using Chain # Pipe operator similar to R's %>%

@chain df begin
    select(Not(:PassengerId)) # Slect all column except Passenger Id
    filter(:SibSp=> ==(0),_) # Filter only passenger with Sibsp=0
    groupby(:Sex) # Groupby sex
    combine(nrow=>:count, # Count number of observation in each group
            :Survived=>mean=>:Survival_rate) # Calculate mean of Survived, and renamed it as Survival_rate
end
:PassengerId, :SipSp, :Sex are Symbol in Julia. In DataFrame, Symbol is used to call a column name (we can use string also)
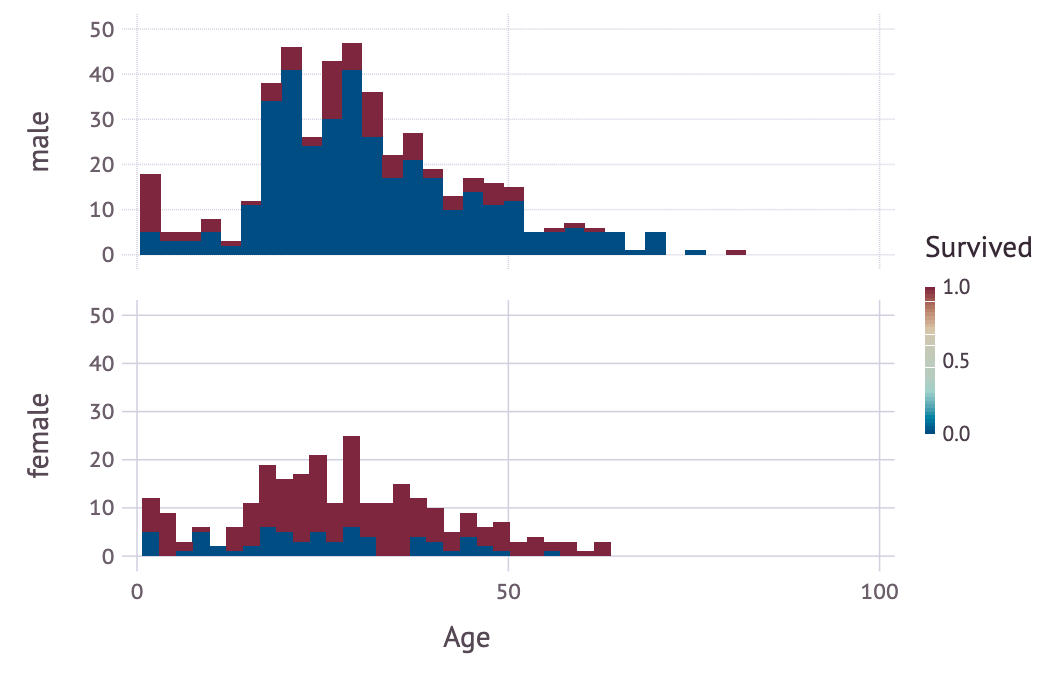
Data Visualization
There are several visualization tools in Julia like Plots.jl, Makie.jl, VegaLite.jl, PlotlyJS.jl and so many more! What I’m gonna use is Gadfly.jl since it adopt “grammar of graphics” just like R’s ggplot2.
using Gadfly
plot(df,
    ygroup="Sex",
    x="Age",
    color="Survived",
    Geom.subplot_grid(Geom.histogram(maxbincount=30)))
Data preprocessing
Let’s remove several columns and create a simple model.
not_missing = sum.(ismissing,eachcol(df)).==0 # Check which column have total missing
df = df[:,not_missing]
df[!,:Sex] = df[:,:Sex].=="female" # One hot encoding,  ! means take the actual value in memory, while : in df[:, means take the copy of the value
drop_column = ["PassengerId","Name","Ticket"]
df = df[:,Not(drop_column)] #Remove the defined columns
first(df,5)
Now the data looks good, let’s proceed to create a machine learning model.
Machine Learning
Since there are tons of machine learning libraries in Julia, MLJ.jl attempts to create a unified interface to all of those packages, just like R’s Caret and PyCaret. Here’s the data preparation part for MLJ :
using MLJ
df_MLJ = coerce(df,:Survived => Multiclass,
               :Pclass => OrderedFactor,
               :Sex => Count, #This type is the closest thing to works, still don't understand why
               :SipSp => Count,
               :Parch =>Count,
               :Fare => Continuous);

X = df_MLJ[:,Not(:Survived)]
y = df_MLJ.Survived ;

train, test = partition(eachindex(y), 0.7, shuffle=true)
The first thing is we need to coerce all the variables into 4 possible types(Continuous, Count, Multiclass, and OrderedFactor), after that we split the predictor and the response and split the index of the train and the test data.
Tree = @load DecisionTreeClassifier pkg=DecisionTree # Load the Decision tree classifier from the DecisionTree library as Tree
classifier= Tree() # Define the model
mach = machine(classifier, X, y) # Machine store the state of the model
fit!(mach, rows=train); # Fit the machine using the train subset
yhat = predict(mach, X[test,:]) # Create prediction from the machine on test data
log_loss(yhat, y[test]) |> mean # Calculate log_loss between all pairs of the y_test, after that calculate the average
Output :
5.662147635868551
Deep Learning
Flux.jl is a pure-Julia deep learning framework where we can formulate all the math-equation from scratch just like Pytorch, or just stacking up multiple predefined layers like Tensorflow-Keras. Here’s an example of Flux in action :
# We continue using data from the previous part
X = df[:,Not(:Survived)]
y = df.Survived ;

using Flux: Data.DataLoader
using Flux: onehotbatch, onecold, crossentropy
using Flux: @epochs
using Flux

layer1(x) = Dense(5,16,relu)(x)
layer2(x) = Dense(16,1,sigmoid)(x)
model_nn(x) = layer2(layer1(x)) #Combine the model

train_data = DataLoader(convert(Matrix,X)', y, batchsize=1) #Flux expects the last dimension to be the observations dim.

number_epochs = 10
loss_fn(x, y) = crossentropy(model_nn(x), y)
optimizer = ADAM();
model_params = Flux.params(model_nn)
@epochs number_epochs Flux.train!(loss_fn, model_params, train_data, optimizer)
┌ Info: Epoch 1
└ @ Main /Users/vinson.ciawandy/.julia/packages/Flux/goUGu/src/optimise/train.jl:136
┌ Info: Epoch 2
└ @ Main /Users/vinson.ciawandy/.julia/packages/Flux/goUGu/src/optimise/train.jl:136
┌ Info: Epoch 3
└ @ Main /Users/vinson.ciawandy/.julia/packages/Flux/goUGu/src/optimise/train.jl:136
┌ Info: Epoch 4
└ @ Main /Users/vinson.ciawandy/.julia/packages/Flux/goUGu/src/optimise/train.jl:136
┌ Info: Epoch 5
└ @ Main /Users/vinson.ciawandy/.julia/packages/Flux/goUGu/src/optimise/train.jl:136
┌ Info: Epoch 6
└ @ Main /Users/vinson.ciawandy/.julia/packages/Flux/goUGu/src/optimise/train.jl:136
┌ Info: Epoch 7
└ @ Main /Users/vinson.ciawandy/.julia/packages/Flux/goUGu/src/optimise/train.jl:136
┌ Info: Epoch 8
└ @ Main /Users/vinson.ciawandy/.julia/packages/Flux/goUGu/src/optimise/train.jl:136
┌ Info: Epoch 9
└ @ Main /Users/vinson.ciawandy/.julia/packages/Flux/goUGu/src/optimise/train.jl:136
┌ Info: Epoch 10
└ @ Main /Users/vinson.ciawandy/.julia/packages/Flux/goUGu/src/optimise/train.jl:136
Final toughs
Learning a new language can be either a wonderful journey or a traumatic experience(lol). For now, I will keep my eye on Julia’s development, waiting for it to reach some degree of maturity.
Last but not least, here’s a list of my thoughts
Positive :
- Julia is like the combination of multiple programming language and paradigm, which make Julia a really ‘expressive’ language to write
- Having a single package manager and environment management is pretty convenient.
- Having info about data types and dedicated missing value type is really helpful compared to Python’s Pandas
- Gadfly.jl use grammar of graphic’s just like R’s ggplot2 so learning it will be easier for people who use R.
Negative:
- There are so many libraries in Julia that competes in doing the same thing, so there aren’t clear answer about which package is the ‘de facto’ standard to choose (except for DataFrames)
- Most of the library(I think) is still in on heavy development, poor documentation and bugged function wouldn’t be something uncommon
- Libraries are still not well integrated between each others
- Understanding error message is a very difficult task for Julia. Here’s the example :
- MethodError: no method matching AbstractFloat(::Type{Any})
Closest candidates are:
  AbstractFloat(::Bool) at float.jl:258
  AbstractFloat(::Int8) at float.jl:259
  AbstractFloat(::Int16) at float.jl:260
  ...

Stacktrace:
 [1] macro expansion at /Users/vinson.ciawandy/.julia/packages/Zygote/CgsVi/src/compiler/interface2.jl:0 [inlined]
 [2] _pullback(::Zygote.Context, ::Type{AbstractFloat}, ::Type{Any}) at /Users/vinson.ciawandy/.julia/packages/Zygote/CgsVi/src/compiler/interface2.jl:9
 [3] float at ./float.jl:277 [inlined]
 [4] _pullback(::Zygote.Context, ::typeof(float), ::Type{Any}) at /Users/vinson.ciawandy/.julia/packages/Zygote/CgsVi/src/compiler/interface2.jl:0
 [5] epseltype at /Users/vinson.ciawandy/.julia/packages/Flux/goUGu/src/utils.jl:36 [inlined]
 [6] _pullback(::Zygote.Context, ::typeof(Flux.epseltype), ::Chain{Tuple{typeof(layer1),typeof(layer2)}}) at /Users/vinson.ciawandy/.julia/packages/Zygote/CgsVi/src/compiler/interface2.jl:0
 [7] crossentropy at /Users/vinson.ciawandy/.julia/packages/Flux/goUGu/src/losses/functions.jl:69 [inlined]
 [8] _pullback(::Zygote.Context, ::typeof(crossentropy), ::Chain{Tuple{typeof(layer1),typeof(layer2)}}, ::Array{Int64,1}) at /Users/vinson.ciawandy/.julia/packages/Zygote/CgsVi/src/compiler/interface2.jl:0
 [9] loss at ./In[21]:11 [inlined]
 [10] _pullback(::Zygote.Context, ::typeof(loss), ::Array{Float64,2}, ::Array{Int64,1}) at /Users/vinson.ciawandy/.julia/packages/Zygote/CgsVi/src/compiler/interface2.jl:0
 [11] adjoint at /Users/vinson.ciawandy/.julia/packages/Zygote/CgsVi/src/lib/lib.jl:188 [inlined]
 [12] _pullback at /Users/vinson.ciawandy/.julia/packages/ZygoteRules/OjfTt/src/adjoint.jl:57 [inlined]
 [13] #15 at /Users/vinson.ciawandy/.julia/packages/Flux/goUGu/src/optimise/train.jl:103 [inlined]
 [14] _pullback(::Zygote.Context, ::Flux.Optimise.var"#15#21"{typeof(loss),Tuple{Array{Float64,2},Array{Int64,1}}}) at /Users/vinson.ciawandy/.julia/packages/Zygote/CgsVi/src/compiler/interface2.jl:0
 [15] pullback(::Function, ::Zygote.Params) at /Users/vinson.ciawandy/.julia/packages/Zygote/CgsVi/src/compiler/interface.jl:247
 [16] gradient(::Function, ::Zygote.Params) at /Users/vinson.ciawandy/.julia/packages/Zygote/CgsVi/src/compiler/interface.jl:58
 [17] macro expansion at /Users/vinson.ciawandy/.julia/packages/Flux/goUGu/src/optimise/train.jl:102 [inlined]
 [18] macro expansion at /Users/vinson.ciawandy/.julia/packages/Juno/n6wyj/src/progress.jl:134 [inlined]
 [19] train!(::Function, ::Zygote.Params, ::DataLoader{Tuple{LinearAlgebra.Adjoint{Float64,Array{Float64,2}},Array{Int64,1}}}, ::ADAM; cb::Flux.Optimise.var"#16#22") at /Users/vinson.ciawandy/.julia/packages/Flux/goUGu/src/optimise/train.jl:100
 [20] train!(::Function, ::Zygote.Params, ::DataLoader{Tuple{LinearAlgebra.Adjoint{Float64,Array{Float64,2}},Array{Int64,1}}}, ::ADAM) at /Users/vinson.ciawandy/.julia/packages/Flux/goUGu/src/optimise/train.jl:98
 [21] top-level scope at /Users/vinson.ciawandy/.julia/packages/Flux/goUGu/src/optimise/train.jl:137
 [22] top-level scope at /Users/vinson.ciawandy/.julia/packages/Juno/n6wyj/src/progress.jl:134
 [23] include_string(::Function, ::Module, ::String, ::String) at ./loading.jl:1091